Brain Mapping Services
EEG qEEG (Brain map)
Why does a brain map help?
One psychiatric diagnosis can result from many EEG patterns, or phenotypes. Each pattern requires a unique treatment intervention.
Your EEG pattern cannot be predicted based on symptoms, therefore, neither can your treatment plan!
This is why the one size fits all treatment approach in mainstream mental health care often fails.
For example:

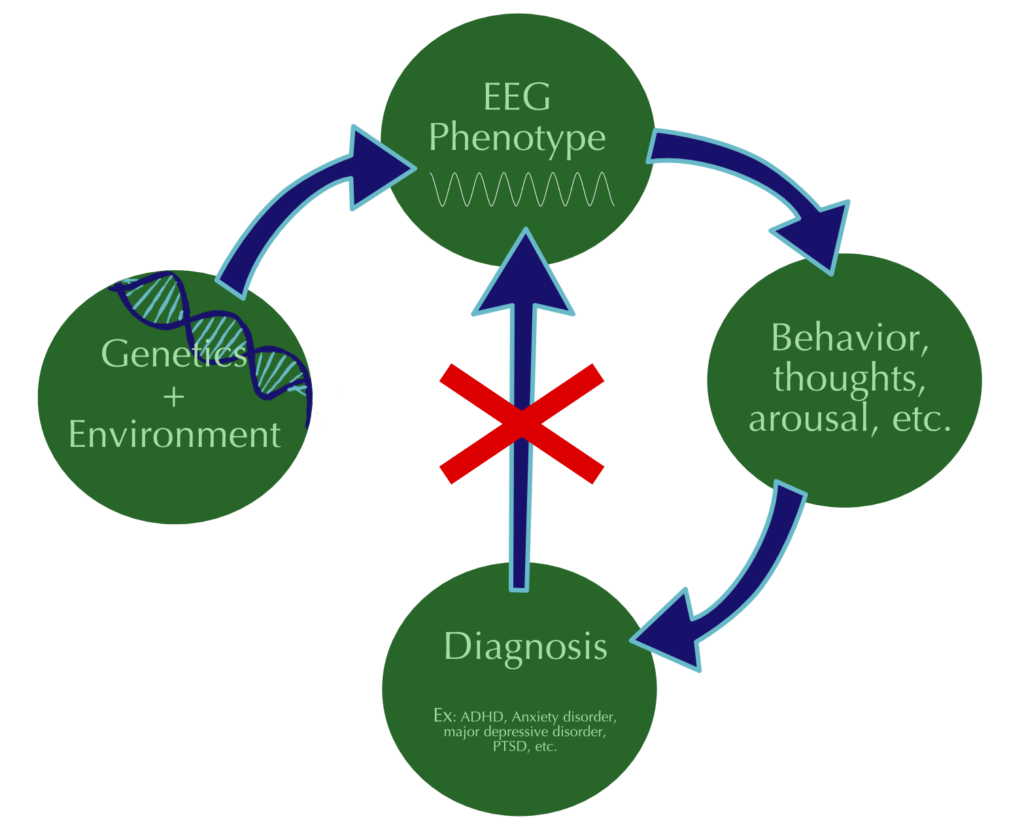 Studies of EEG in varying psychiatric populations have resulted in the identification of unhealthy EEG features. The subjective experience of a diagnosis can vary greatly, making the identification of subtypes within a diagnosis through EEG analysis a particularly attractive practice for the identification of root causes and formulation of effective treatment. EEG divergence patterns, or phenotypes, provide reliable indices of brain functioning. Behavioral groupings based on diagnoses do not reliably predict observed EEG phenotypes or treatment response. Have you ever wondered why you have tried so many different treatments, with little to no success? Symptoms are the result of the brain’s electrical activity, however, one symptom can result from a variety of different EEG footprints. The root causes of one symptom, or diagnoses, varies greatly, making it essential to look at the organ we are working to treat. These observable EEG patterns, or phenotypes, bridge the gap between genetics and behavior by providing a measurable intermediate step: brain activity (Gunkelman, 2005). By identifying the root cause of symptoms, we are able to treat the source. EEG phenotypes do not directly correlate with the Diagnostic and Statistic Manual of Mental Disorders (DSM), meaning that the same phenotype may be seen in several diagnoses. Instead, phenotypes cut across DSM categories, and unlike the DSM, phenotypes predict treatment response. Due to the treatment response prediction, phenotype identification was responsible for the doubling of clinical efficacy in the treatment of ADHD, as compared to behaviorally based interventions (Wright & Gunkelman, 1998).
We base our treatment plan off hard-data acquired from the live activity of your individual brain, removing the guesswork from mental healthcare.
What to Expect?
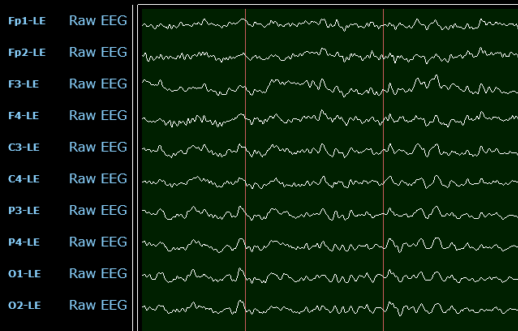
First, you will receive intake questionnaires to provide us with a thorough understanding of your mental health history. This is essential to the process as it allows us to connect the dots between your brain map and symptom presentation. The brain map data is acquired through an in person QEEG session that takes 1 hour to complete. You will sit comfortably in a chair with a cap containing EEG sensors placed on the head. In order to obtain a clear signal, the sites will be cleaned and prepared with electrogel. Each of these 19 sensors will record brain activity at a distinct site on your brain. 2 additional sensors placed on the earlobes, areas of no electrical activity, will be used to provide a baseline. Next, your brain activity will be read for 10 minutes with eyes open, and 10 minutes with eyes closed. After obtaining EEG data, we will use statistical and visual analysis to determine the root cause of your symptoms. You will be able to come back within one week of the recording to review the map and begin training!
Steps of EEG Analysis
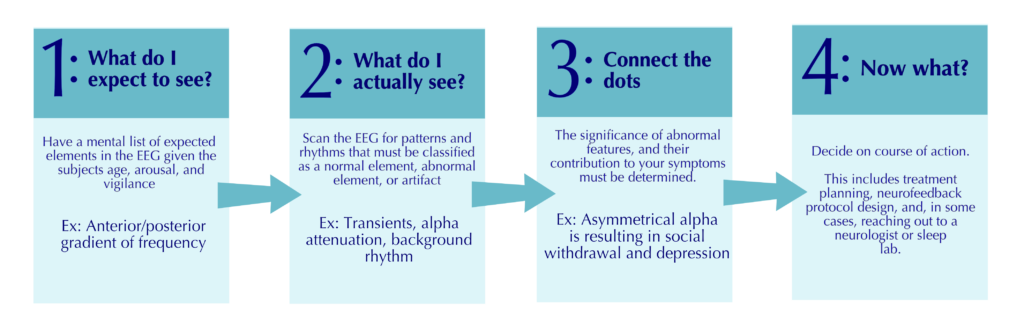
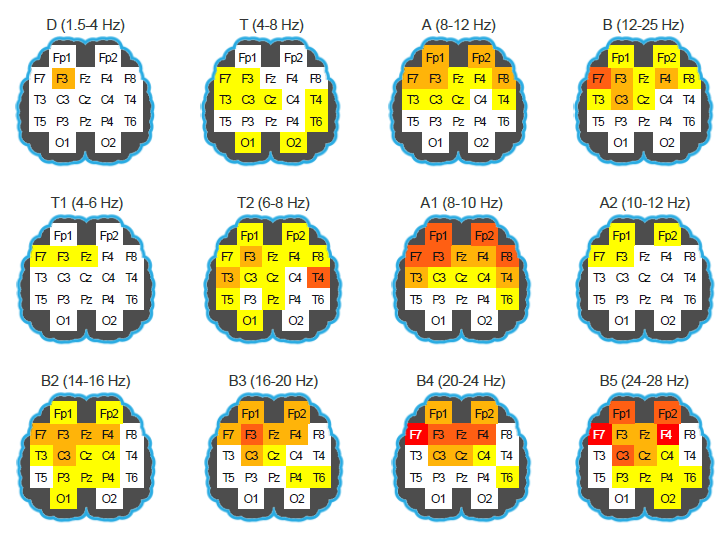
In the last several decades, studies using qEEG analysis and traditional assessment have allowed for the identification of specific electrical features observed in different mental health conditions. Network analysis provides novel insights into optimal and dysfunctional brain architecture such as deficits in engagement and access to large scale neuronal networks that play a prominent role in optimal functioning. This data provides a link between the brain and behavior, allowing for a disruptive and necessary shift in how treatment plans are crafted. Following removal of artifacts from the EEG using a program called WINEEG, the cleaned EEG file undergoes analysis. Complex computation allows us to obtain many measurements of brain activity including power analysis, coherence measurements, independent component analysis, and Low-Resolution Electromagnetic Tomographic Analysis (LORETA). This computation and firsthand inspection of the waveform allows for the identification of phenotypes, vigilance, and finally the formation of brain maps.
Why is Visual Inspection of the Waveform Essential?
A thorough EEG analysis not only includes software computations, but also visual inspection. While these software’s provide advanced analysis of EEGs to produce colorful brain maps detailing connectivity, power, coherence, and statistical comparison, they fail to identify individual abnormalities in waveforms. A brain map is formulated based on averages of the total recording, and because of this, important individual wave features, that may only occur once over a recording period are missed. Concerning wave features that merit a neurological or sleep lab referral are only identified via visual inspection. For example, muscle tension in the jaw shows up as excessive fast activity in the brain if it is not properly identified during visual inspection. If a clinician is not visually inspecting the EEG, crucial information is excluded from the data. The brain map is an excellent tool that provides wonderful insights into functioning, but without visual inspection, it is less reliable.